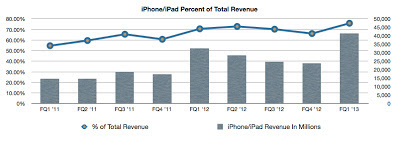
For the fiscal quarter ended Saturday, December 28th, Apple will report record revenue and earnings per share. There’s no disputing the popularity of Apple’s iPhone and iPad product lines. As of today Wall Street analysts are expecting revenue of $57.31 billion and earnings per share of $14.05. This is in contrast to revenue of $54.51 billion and eps of $13.81 in the prior-year quarter.
As the founder of the Braeburn Group, I am currently collecting December quarter estimates from our global network of independent analysts. Although management has guided to revenue in the quarter of $55 billion to $58 billion, the independents by and large are expecting a revenue performance above the upper threshold of guidance. I will be publishing the Braeburn Group Estimate Index for the quarter on Sunday, January 5th.
However, Apple’s quarterly results are merely a static snapshot of a fast-moving enterprise object. More than a purveyor of independent device lines, Apple has become a customer relationship continuum with a global platform of inter-related products and services.
Among the factors influencing near-term results are management’s decision to increase the amounts of device sales revenue deferred for recognition in future periods, the pace of the company’s geographic expansion and the seasonal nature of the company’s product refresh cycles. Apple’s growth is best viewed not by quarters but by fiscal years. In today’s article I will look at Apple’s growth across a variety of measures and metrics.
Apple: It’s A Matter of What, Where and Why
The graph below illustrates Apple’s FY2013 revenue mix by product line. In the fiscal year ended in September, over 72% of the company’s reported revenue was derived from the iPhone and iPad product lines. While this concentration of revenue in two product lines for a company that reported over $170 billion in revenue might on the surface seem alarming, the concentration of revenue is emblematic of Apple’s dynamic product mix and the changing nature of the digital device markets.
The graph below illustrates Apple’s revenue growth by product line in fiscal years 2012 and 2013. In FY2013 the rates of revenue growth in year-over-year comparisons were impacted by the release of the lower-cost iPad mini and slowing rates of growth in the high-end smartphone market. While the average selling price (ASP) for the iPhone fell from $629 in FY2012 to $607 in FY2013, the average selling price for the iPad fell from $531 to $450.
Moving into FY2014, the reported ASP for the iPhone will be impacted as much by the recent change in deferred revenue on each iPhone sold as any other factor. Apple’s apparent ability to meet demand for the iPhone 5s more quickly than for any new iPhone release in the past will assist in stabilizing reported revenue per unit sold.
The Retina display iPad mini, at a higher per unit price than the original, will buttress the iPad’s ASP this fiscal year. In FY2014, there will be a stronger correlation between the rates of unit sales growth and revenue growth than in the slower-growth FY2013 that ended in September.


